

More control over VAT. Less manual work.
Bring financial data, VAT controls and assessments together. With ZendBase Tax you make deviations visible, investigate differences and record your conclusions.
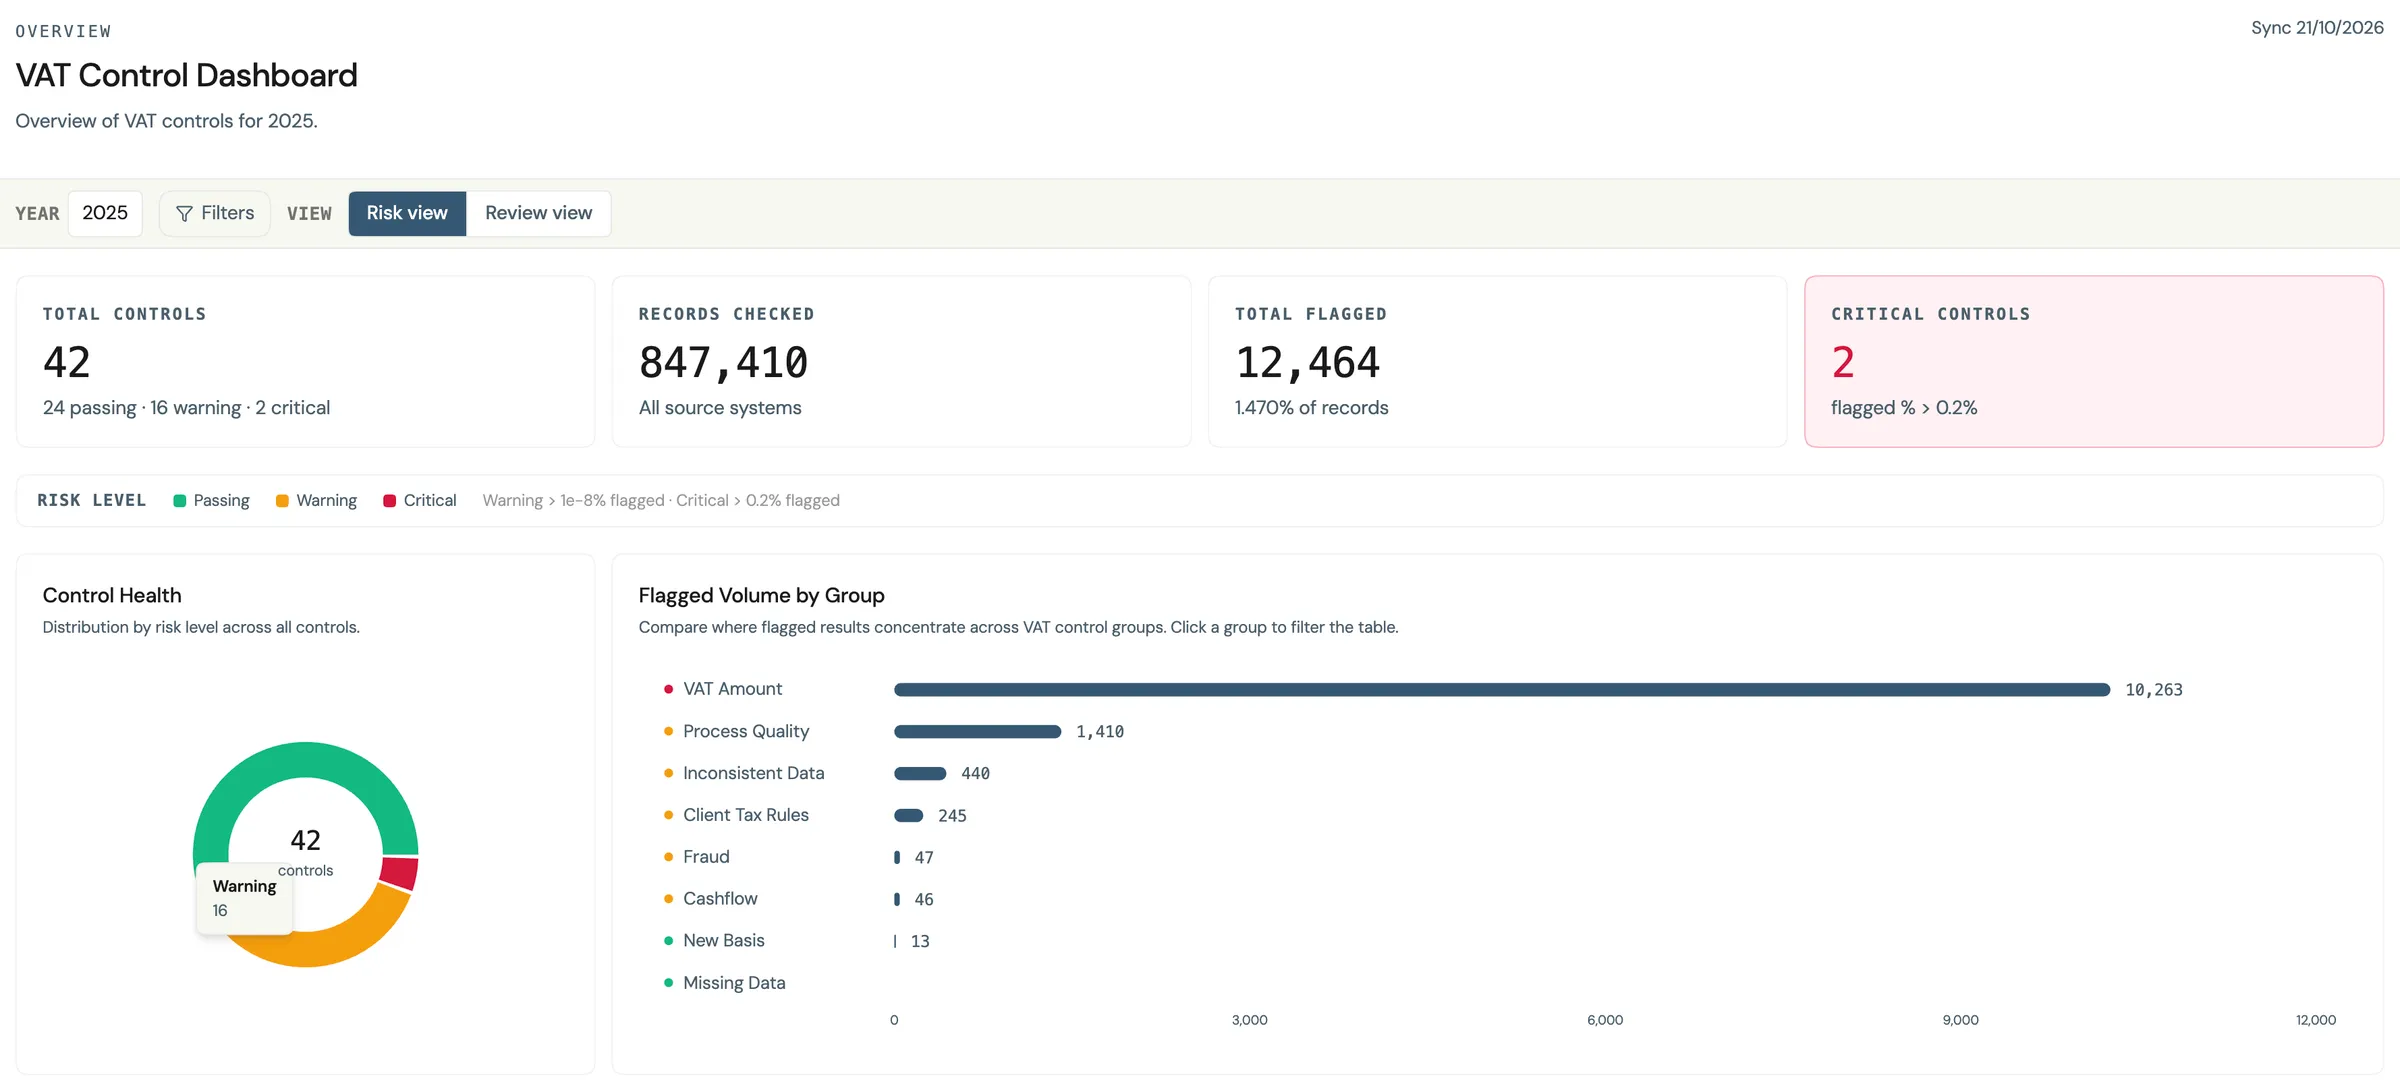
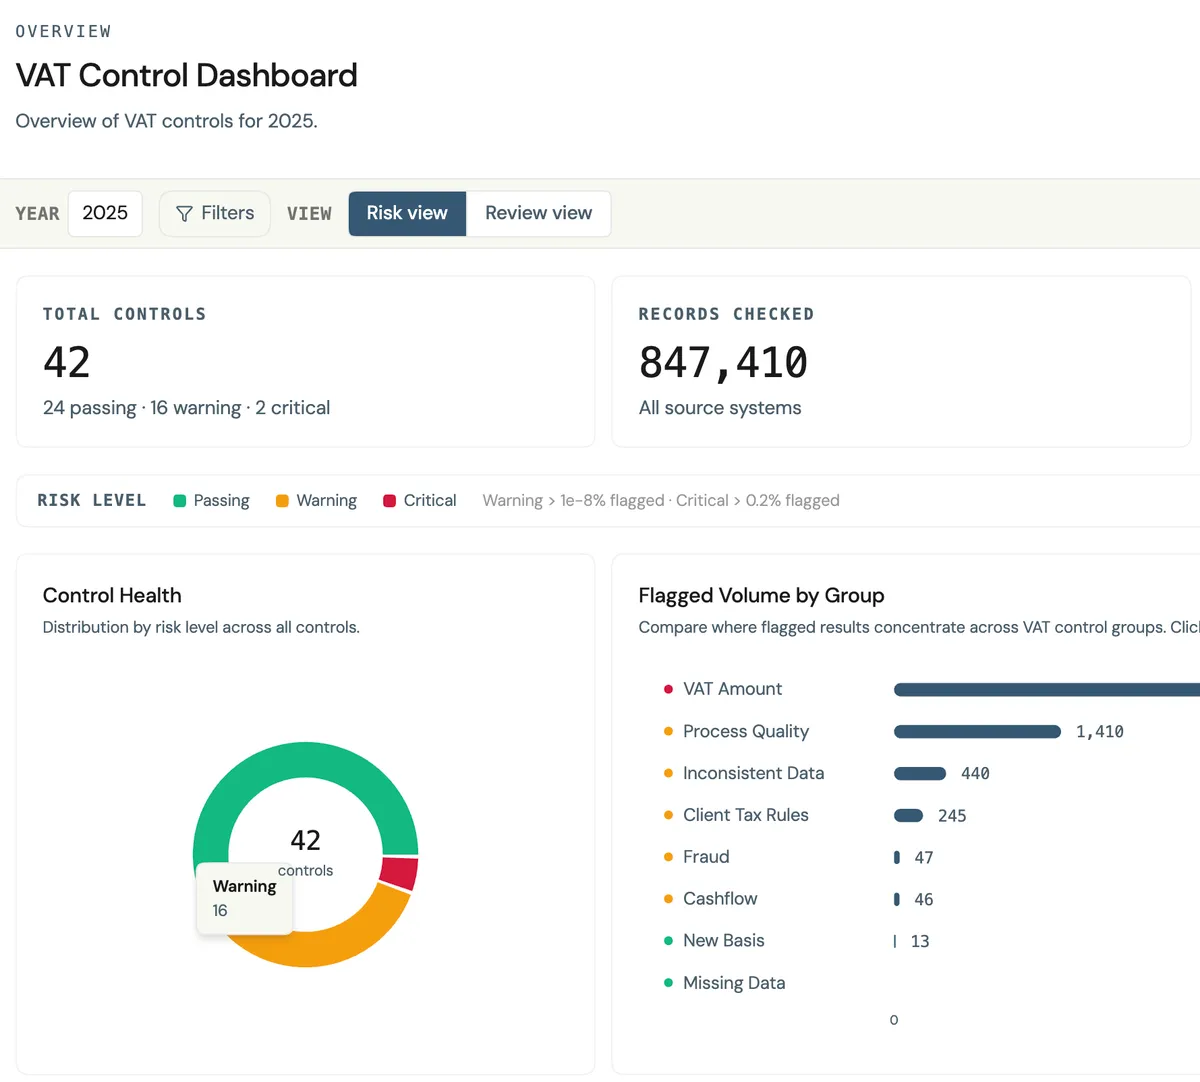
The control dashboard: where signals gather and how review work progresses.
The day to day
The work is familiar. The overview is not.
Exports, manual checks and scattered spreadsheets make it hard to keep oversight across periods and entities. Each period the pattern starts again: export, check, explain.
Data from different administrations
Figures come from more than one financial administration. Before you can set them side by side, there is export, conversion and matching.
Recurring checks and investigation
The same questions return every period. Does the VAT code hold, does the amount agree, and which item needs a closer look.
Findings spread across tools
A signal lives in one file, the explanation in another. The conclusion is then hard to find again.
How it works
One connected control process
Source data is standardised for analysis. VAT reconciliation, sampling and dashboards support the same process. Which connection is possible depends on the source system and on your organisation.
- 01
Collect data
Financial data from the source administration, brought onto one structure so controls can run on the same population.
- 02
Check
Automated VAT controls on the imported population, according to the rules that have been configured.
- 03
Assess
Investigate a signal, assign responsibility and record a judgement.
- 04
Document
Explanation, history and sampling results stay with the finding.
Controls
Automated VAT controls
Controls run on the imported population, in line with the configured rules. Standard controls can be supplemented with rules that belong to your organisation.
- Missing or unexpected VAT codes
- Differences between base amount, VAT rate and VAT amount
- Inconsistencies between master data and transactions
The dashboard shows where signals concentrate, what needs attention and how review work progresses. A flagged transaction is a signal. Assessment comes after that.

Assessment
Assessment and follow-up
From a finding you inspect the transaction context. You assign responsibility and record priority, status, judgement and explanation. The change history stays available.
Automation supports the tax specialist and the controller. A signal is not a confirmed error. They decide what it means.
- 01
Signal
A control flags a transaction that needs attention.
- 02
Investigate
You review the finding together with the transaction context.
- 03
Assign
You record who takes it on and what priority it has.
- 04
Judge
Status, judgement and explanation are stored with the finding.
- 05
History
Changes stay available to consult.
Reconciliation
VAT reconciliation
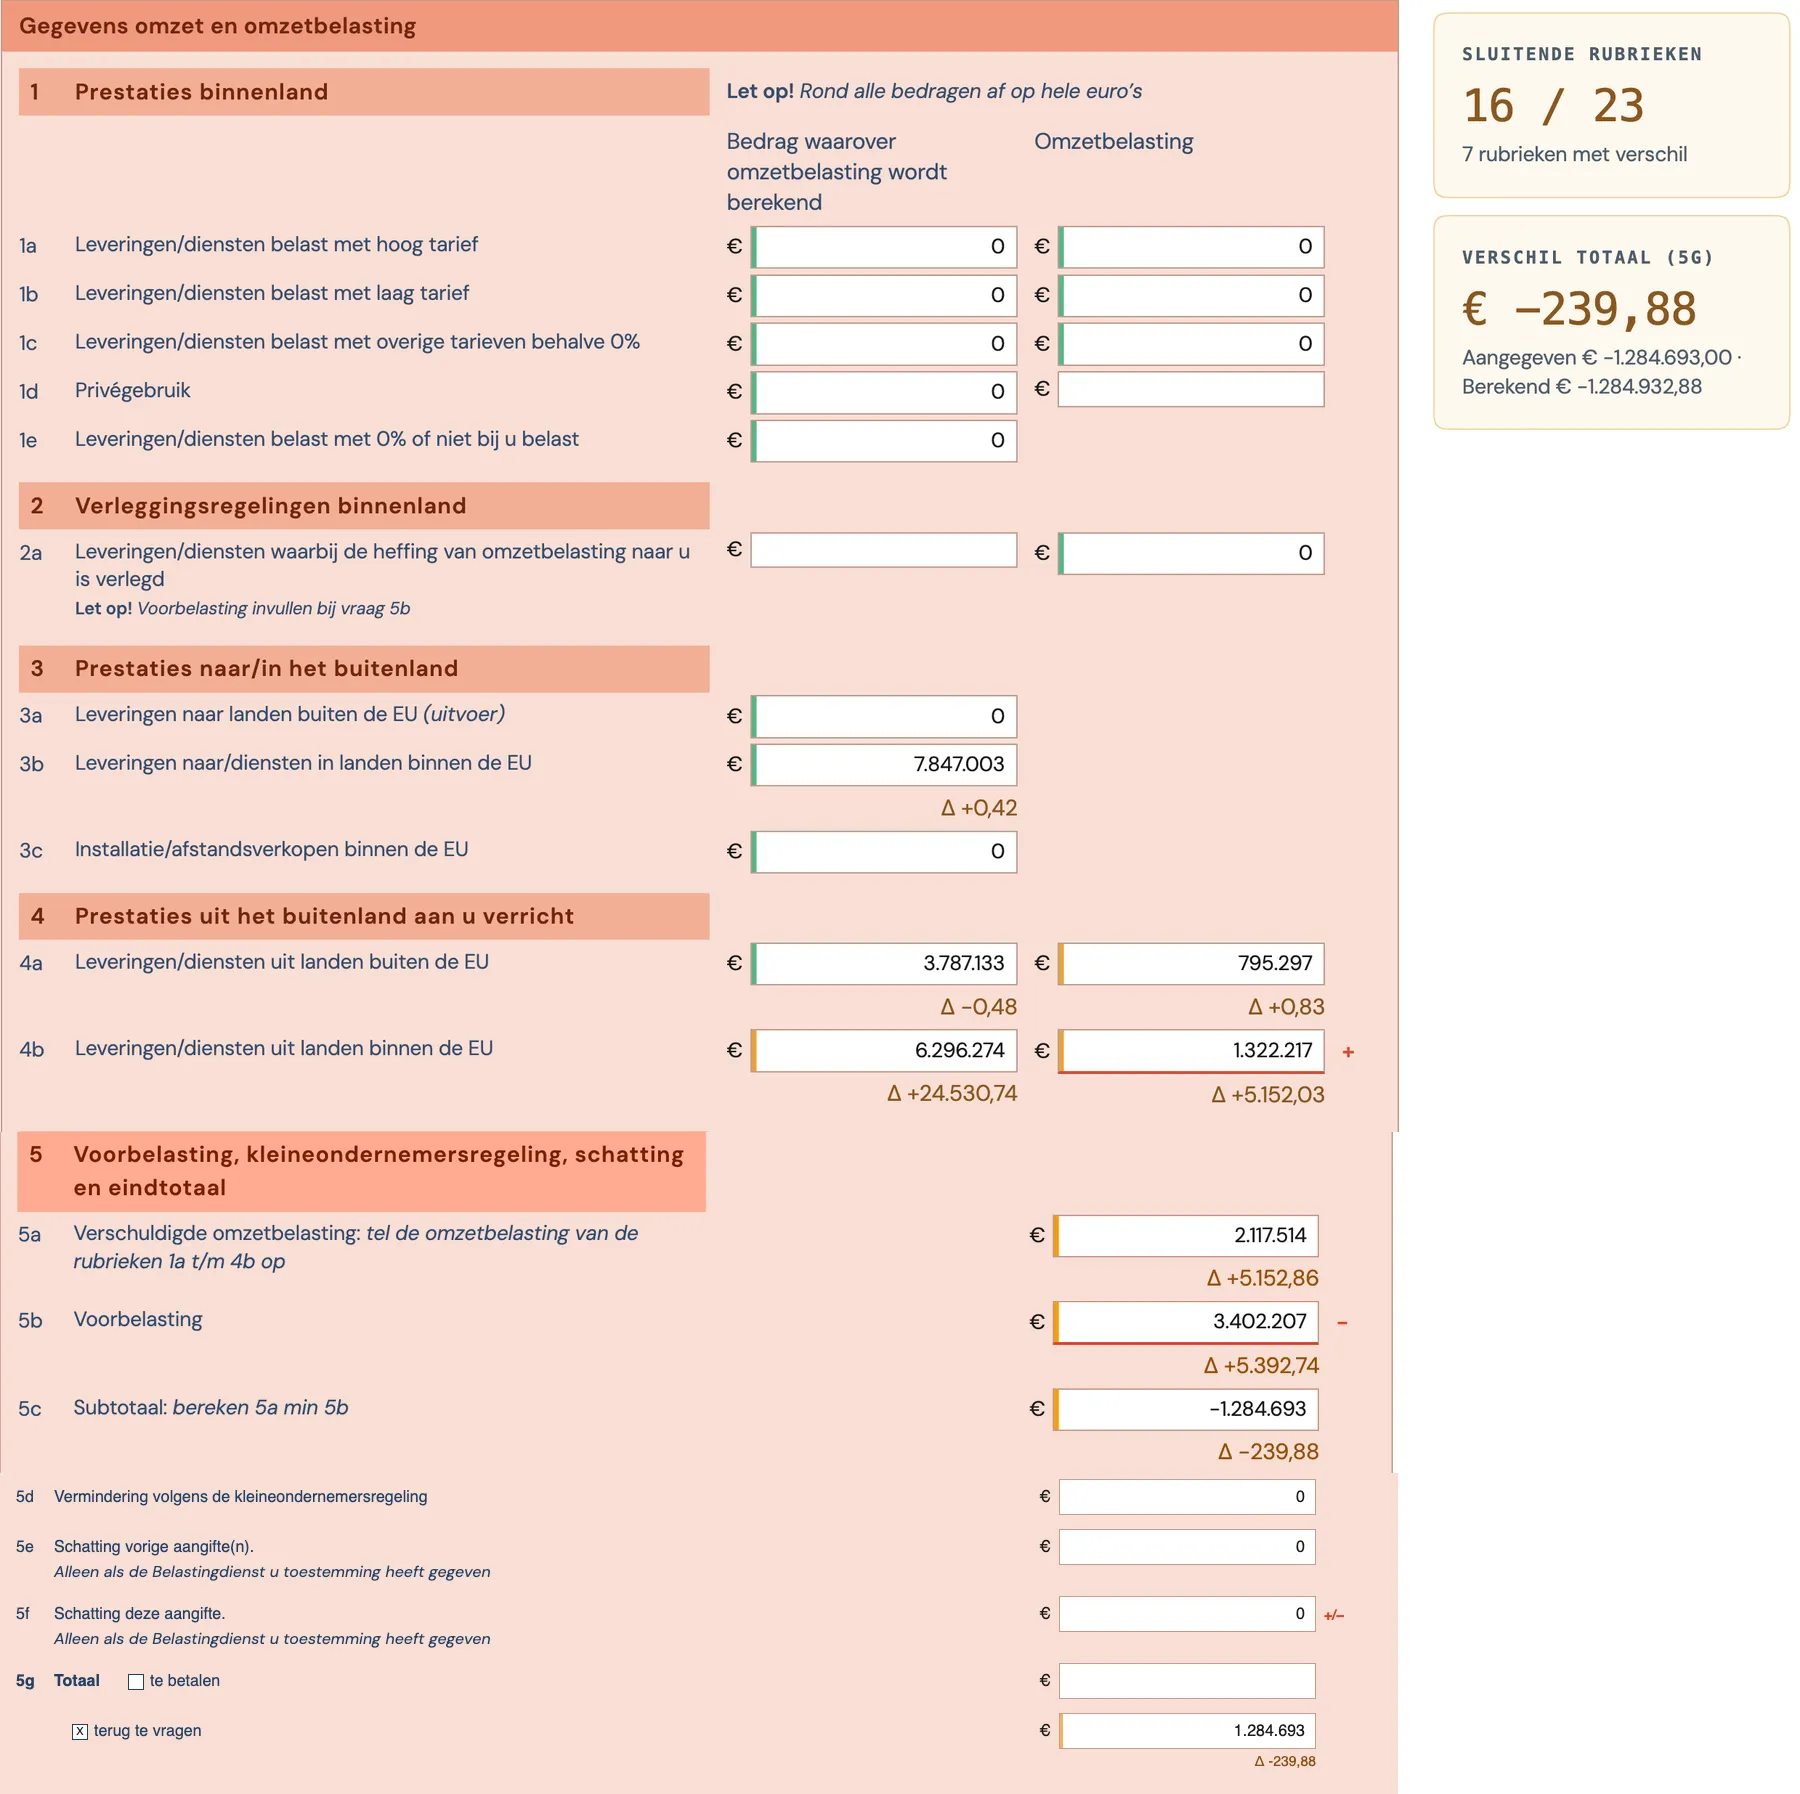
You compare Dutch VAT return figures with amounts calculated from the transaction data, per return category. Differences and the explanation of the mapping guide the investigation.
Not every category drills through to invoice level. The reconciliation shows the difference and where the explanation comes from.
Sampling
Sampling
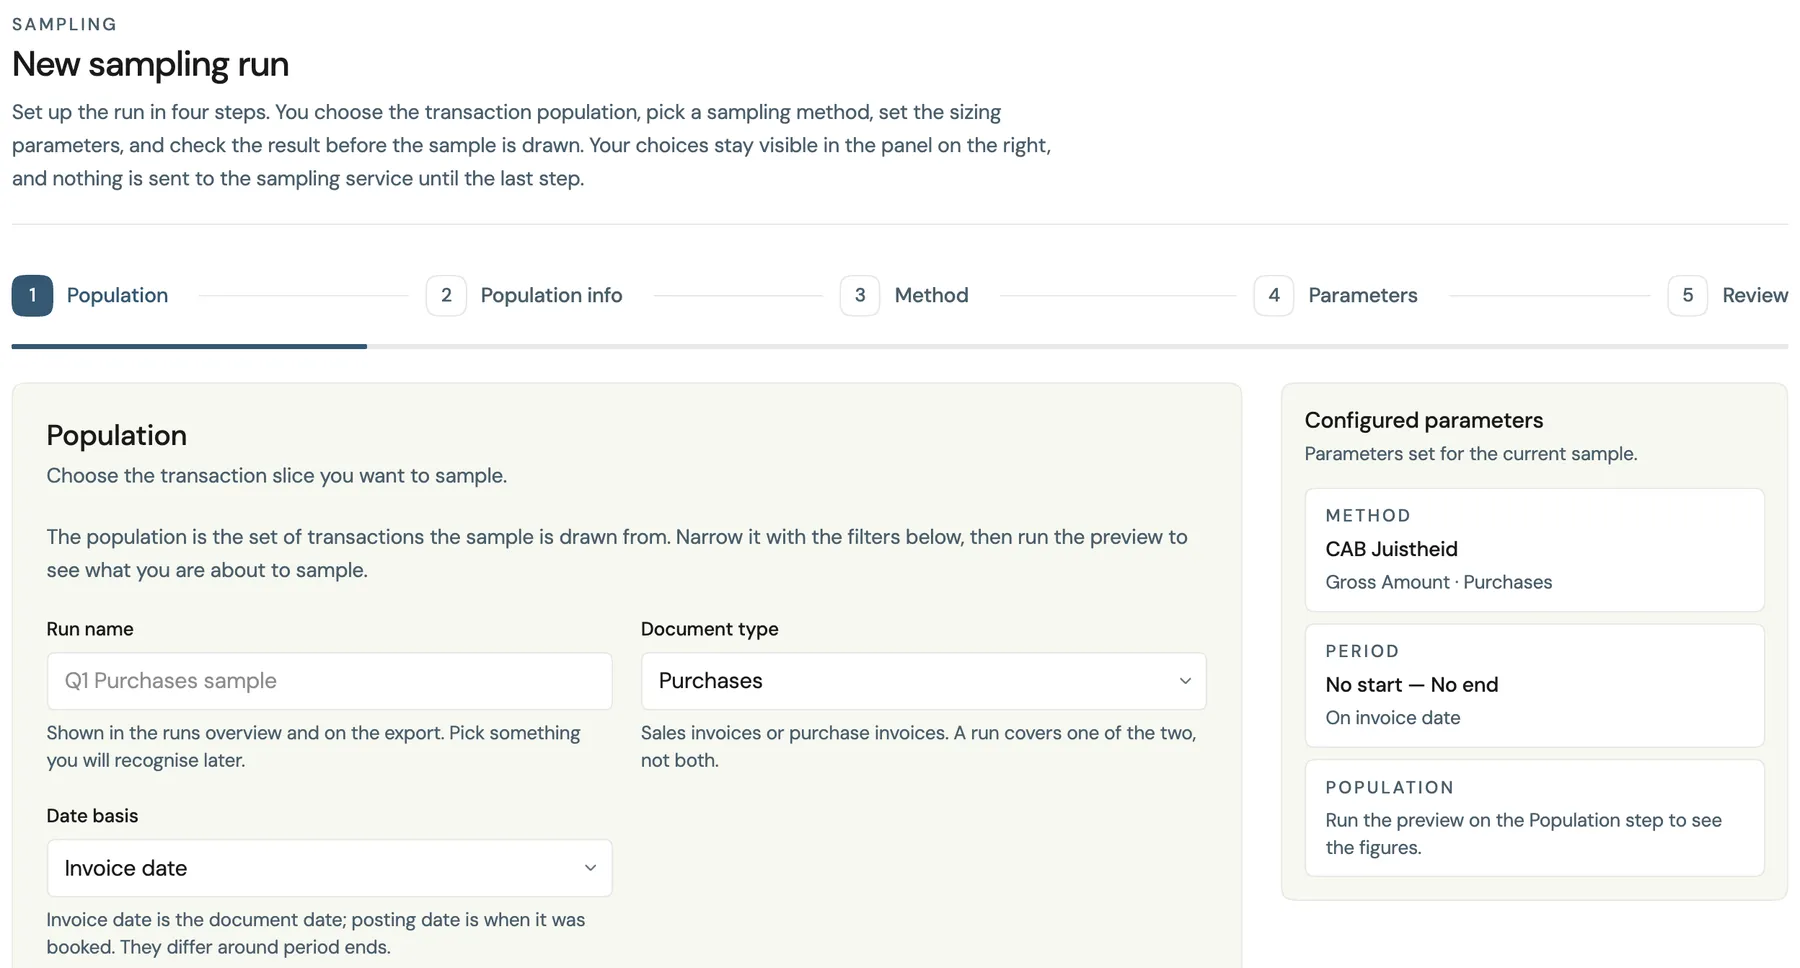
You define a population, choose a method and suitable parameters, keep the selection, assess the selected records and document evidence and results.
The recorded population, settings and selection make the sample reproducible. ZendBase Tax does not impose a fixed confidence level and does not promise acceptance by a regulator.
Geography
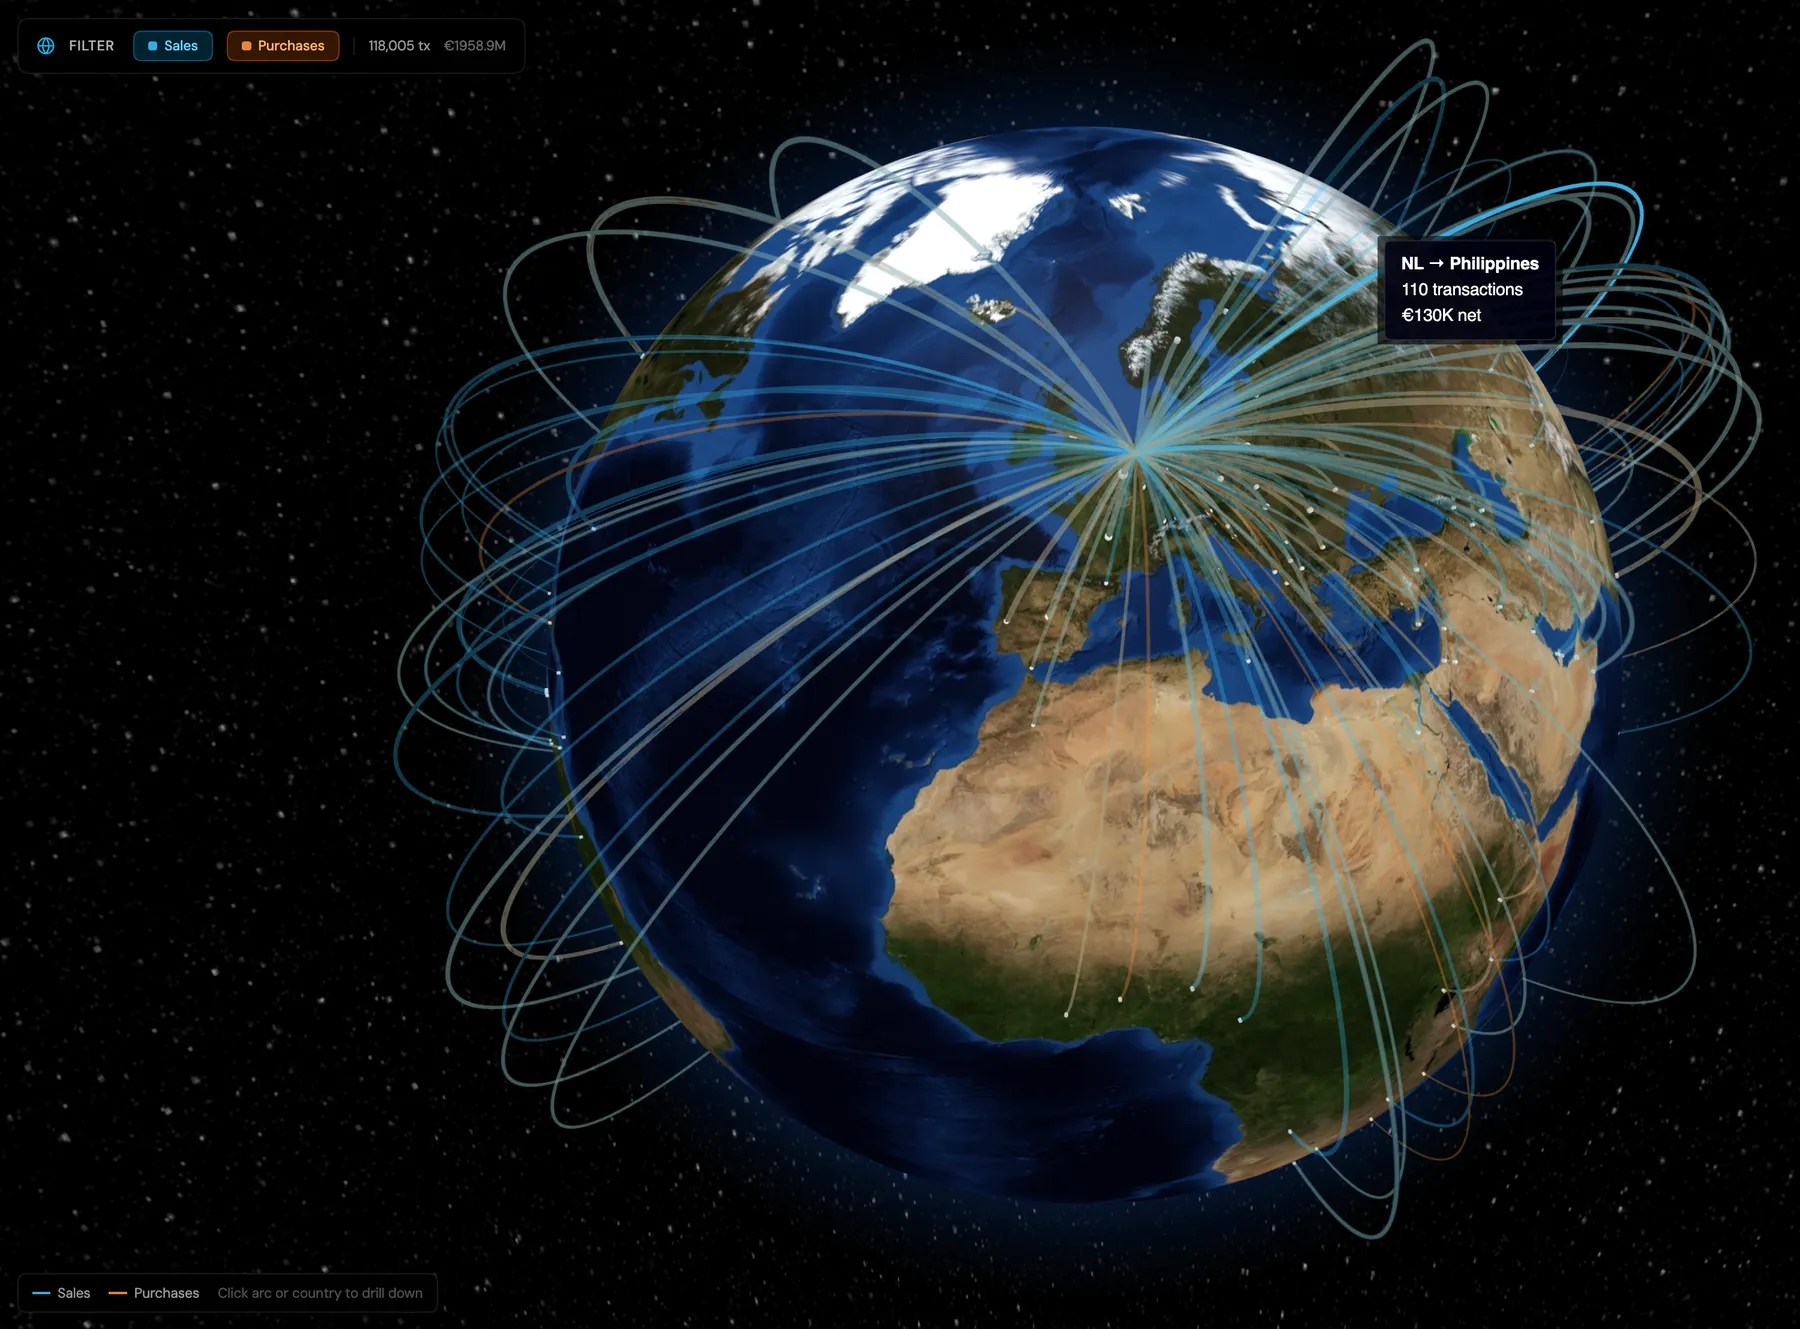
Make international transaction flows visible
ZendBase Tax gives geographic insight into purchase and sales transactions. You see where flows come from and where they go.
This is insight into your transactions. It is not coverage of tax rules worldwide.
Start
Start with a concrete question
A first conversation is about one entity, one period and one control question. From there it becomes clear what the data will support.
How long that takes depends on the source, the data quality and the question. We do not commit to a fixed implementation time.
- 01
Choose the question
One entity, one period and one control question.
- 02
Inspect the data
Which data is available, and what the data quality looks like.
- 03
Configure
The controls and mappings that belong to that question.
- 04
Validate
Walk through the findings with finance and tax.
- 05
Repeat and extend
A process you can run again, and extend where that is useful.
Demonstration
What shows up in your data?
Discuss a demonstration, or a scoped exploration with one entity and one period.
- One entityA scoped starting point
- One periodA period you know well
- One control questionWhat you want to make visible