
A systematic approach to dashboard development
In this blog, we explore the key steps to creating effective dashboards that align with your business goals. Whether you're a data analyst, a business leader, or part of a BI team, we'll guide you through the process to ensure your dashboards deliver meaningful insights and drive action.

Spent 3 days building on a dashboard no one uses? Let’s fix that!
Disclaimer: Yes, Power BI users, we’re using the word ‘dashboard’ deliberately to refer to a Power BI report.
Your company has just created these super pipelines, and what comes next? Making a dashboard, of course, to showcase all the cool data the data engineers have prepared. So, you go ahead with it and make a dashboard. But then you realize that team A asks you to include feature A, and team B asks you to include feature B. Oh, but wait, you don’t actually have the data for that extra graph.
Then the CEO comes and says, “But that’s not what I’m interested in seeing.” Then the operations team comes, and they want to see details. The deadline is tomorrow at 11. So, you just have to go ahead with building something, right? Sounds familiar?
As with any project, it’s not uncommon to get excited by all the tools at our disposal and start using them, such as Power BI, for example, without a clear plan or goal in mind. We’ve been there as well.
But why might that be a problem? Well, because implementing a new project without a clear scope defined, will mean that we make inefficient use of resources, such as the time of the BI team. This team will spend time going back and forth with developing features that might have been unnecessary from the start. So, we waste precious time, and some people might be disappointed that their requests were not included.
And the dashboard in which you put so much work ends up gathering dust in a corner, with barely any people using it. Now imagine, not just one dashboard, but ending up with 100+ dashboards because of this.
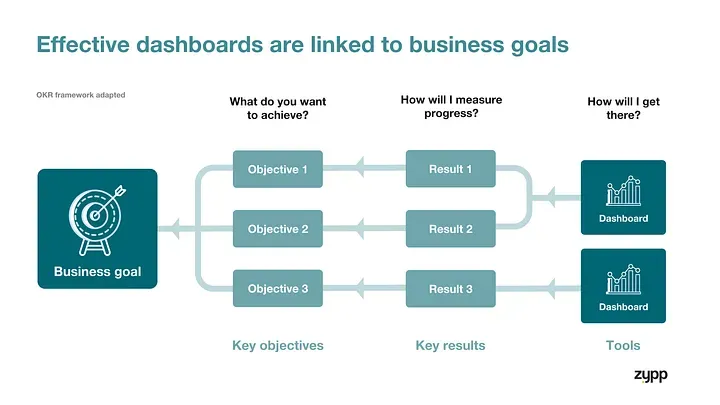
Making sure that we follow a good project management system can mitigate these issues. Let’s reconfigure the situation. Dashboards, as with any other tool in your company, should answer a business need. Whether you have a top-to-bottom approach, where the CEO/CFO requests dashboards, or if your company follows a self-service approach, where data analysts can have a go with a cool idea, each dashboard should be linked to a business goal. Otherwise, you might end up in the situation described above.
As in the chart below, each dashboard should be directly linked to a key objective that’s related to an overall goal of the company.
So, how can you achieve that? Well, everything starts by asking questions and involving all the relevant people in the process. This is a process that works best for us. Feel free to be inspired by it.
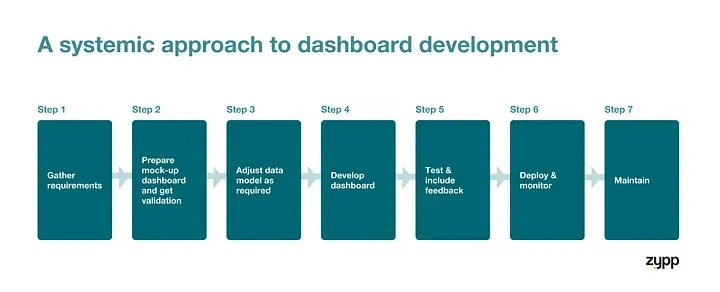
Step 1: Gather requirements
Start by gathering requirements. Here are some useful questions you can ask:
- What dashboard do we need?
- What is the goal of the dashboard?
- What questions or business problems are we trying to address?
- Who will use the dashboard? Operations? CFO?
- How will they consume the dashboard?
- Are there any requirements?
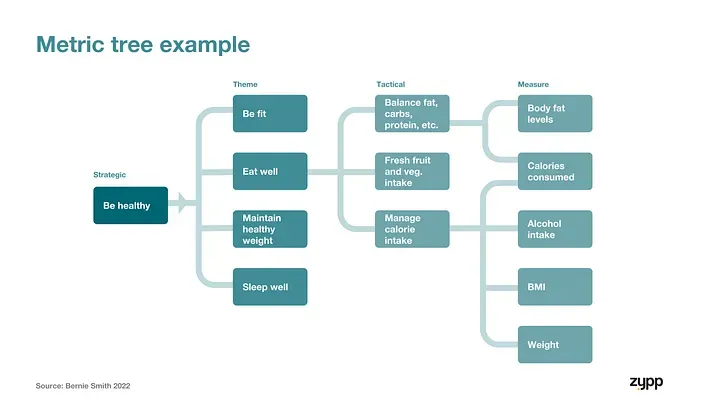
After you get answers to these questions, you’ll have a clear idea of the dashboard’s goal, and you’ll be ready to determine which information to include. Define which KPIs are most useful. To do this, you could use metric trees. Metric trees help you trace back what factors influence the KPIs you’re interested in.
Step 2: Prepare mock up dashboard and get validation
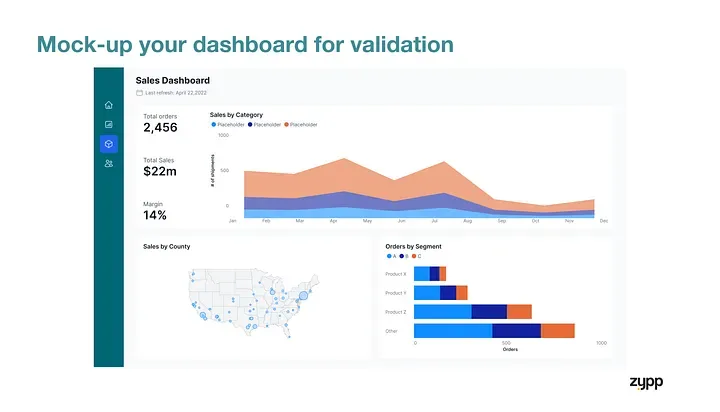
Now you’re ready to create a mock-up. We prepare mock-ups to ensure expectations are aligned between our team and clients. We use Figma for this part, but you could even use PowerPoint. Here’s an example of a mock-up. You can go into as much detail as you want.
Step 3: Adjust the data model
After we get approval of the mock-up, we move ahead to adjusting the data model to the dashboard needs. Yes, we don’t make the dashboard, or Power BI, adjust to the data; we focus on creating views on the back end that are built with the single purpose of providing data in the best and most efficient structure for our dashboard.
Why not just go ahead with the already available data? You can do that, but for sure, it will mean you’ll have to make data transformations in the dashboard, and we’re strong advocates of making as many transformations and calculations on the backend as possible. This improves the dashboard size, refreshing times, and makes the dashboard way simpler, ultimately impacting the user experience.
Step 4: Develop your dashboard
Now you have a solid idea of what you have to build, data ready, so you go ahead and build your dashboard! If you were tidy with the previous steps of the process, you’ll realize this part is much faster!
Step 5: Test, include feedback ; Step 6: Deploy & monitor ; Step 7: Maintain
After testing and including final feedback, our dashboard is ready! But wait, that’s not all. Monitoring use and maintaining dashboards are post-activities that require people in charge. So, make sure not to overlook these steps. While we won’t go in detail about these steps here, as this blog focuses on the development phase, their importance should not be underestimated.
We’ve highlighted the key points that can make or break your process. While our approach provides basic points, the process can become much more complex depending on your team’s structure. You can select specific points from our suggested approach and tailor it to your company’s needs. If you’re curious about exploring further, check out the blog Microsoft published in April 2024 on Content Lifecycle Management.
We understand that not every company is ready to dive into structured processes like this. It takes time, resources, and perhaps your company has other priorities. But here’s the thing: following a process like this can make a significant difference. A systematic approach to dashboard development offers several benefits:
- Efficient resource utilization: Save your team’s time and effort.
- Improved communication and collaboration: Foster better teamwork.
- Enhanced user experience: Deliver dashboards that users love.
- Maintainable and scalable solutions: Build dashboards that grow with your needs.
Need a hand developing a dashboard or getting your BI team on track? Let’s chat! We’ve got tons of ideas to share and have helped our clients navigate the ins and outs of dashboard development.
Did you find this article interesting?
📃 Check out our previous blog as well: Zypp & Jeroen: Looking back at year one
✅ Make sure to follow us on LinkedIn for new content!